Layer of protection Analysis - LOPA - HSE guide
Layer of protection Analysis - LOPA
There
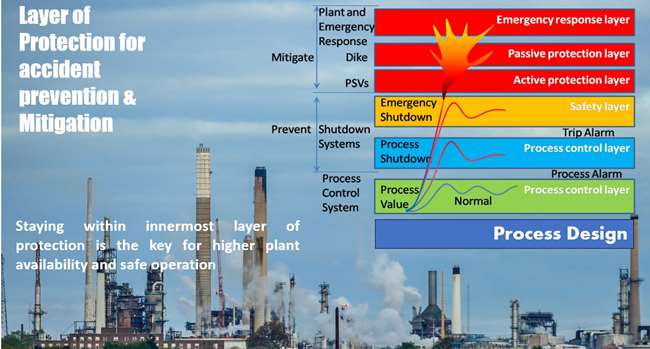
are seven layers of protection for accident prevention and
mitigation. Each layer is important as some are for prevention and other are
for protections. Staying within inner most layer of protection is
the key for higher plant availability and safe operation. Maintaining other
layers of protection intact, ensure prevention and mitigation of accidents.
In
this article we will discuss what LOPA is and how it is carried out step
by step.
The
Layer of protection analysis (LOPA) is a risk assessment tool
developed within the framework of an international standard to quantify risks
in order to reach a specific probability objective. It is a systematic
decision-making process and one of the methods for determining the risk
associated with various hazardous process events using their severity and the
probability of the events occurring.
Applicability of LOPA
LOPA is
generally used for high-risk scenarios where the quality of the decision must
be higher and allows a multidisciplinary team to assess the risk with greater
clarity and more explicit decision criteria. It is used to ensure that a design
is not under-designed, that the design is not over-designed, that people are
not exposed to excessive risk, to verify that operating resources are adequate,
don't waste money, etc. Thus, LOPA is concerns about allocating
appropriate resources proportional to the risk.
Concept of risk acceptance / tolerance in the LOPA
Before
starting the layer of protection analysis (LOPA), the company
must define the tolerable frequencies for events with high consequences.
The
LOPA is used to assess a specific scenario to determine whether it is
acceptable, depending on the consequence, risk tolerance may differ from one
person to another. Therefore, when analyzing the layer of protection, the
challenge is to have a team of experienced people with diverse backgrounds and
objectives to make rational business decisions (a rational business decision is
a decision that makes sense for long-term business).
Sometimes
a decision may make sense for the life of the project but will expose an
installation to undue risk or it is on the way. The level of risk acceptance is
expressed in terms of tolerable frequency which is the maximum number of events
expected per year, which is considered practicable, achievable, sometimes this
can be expressed in terms of probability. The tolerable frequency is the
decision criterion for design and operational changes. It is a risk tolerance
objective set by a company and often aligned with society's expectations to
make consistent decisions. The justification is simple, the more the
consequence decreases the tolerable frequency. As a general rule, the industry
accepts a 0.01% chance of a single death in a given year, i.e. the risk of
death is 1 in 10,000 for an individual per year. It would expect several deaths/
multiple fatality to be less tolerated with a tolerable frequency of 0.001%
chance per year. More serious is the consequence of lowering the tolerable
frequency.
Decide
on the level of risk tolerance in the business to set the business goals. The
operator can set the target by focusing on quarterly production targets, the
project manager focuses on lead times and the tolerable frequency should be set
at the company level while the risk is perceived at the portfolio level.
Concept of conducting a layer of protection analysis
The
LOPA begins by focusing on a single consequence and applies to the higher
severity scenarios identified in the HAZOP.
We
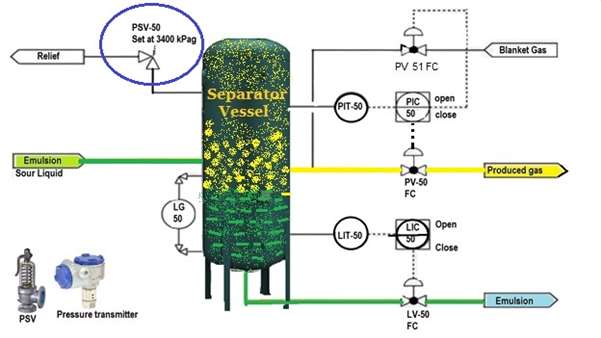
will take the help of the schematic diagram below to understand the concept
layer of protective;
 |
| Fig-1 - Schematic diagram of separator vessel with pressure valve at gas outlet |
Suppose,
in an example above, consider a separator vessel over pressurizing, the worst
credible case of a vessel rupture results in the death of a single worker
nearby. Now, we must apply the tolerable frequency of the over pressure of the
separator vessel which can cause death according to the standards defined by
the company. Then think about, how can a company reasonably tolerate it, how
can an engineer demonstrate that the design is as low as reasonably practicable
(ALRAP). From now on, designing this process according to the consequence of
the death of a single worker can occur at most at 0.01% per year.
At
this point, we now need to determine what triggered the consequence and the
likelihood of it happening. We must send back the HAZOP, the cause of a
deviation in an HAZOP is the initiating event in the protective layer. If we
see in our study example, the triggering event is the faulty pressure control
valve in the closed position. There is a blocked flow from the gas line
produced when the PV-50 is closed, causing the vessel to over pressure. let's
say that the pressure control valve has a probability of 0.1 of failing to close
in a year or in other words, the expected inadvertent closure is once every ten
years.
Now
the next step is to identify the independent protective layers in the system,
these are mechanisms that prevent the consequences from occurring. These
independent layers of protection are the safeguards identified during a HAZOP
to assign a backup. As an independent protective layer, it must meet specific
requirements defined by international and regional standards. It is important
to remember that the protective layer must be independent of the triggering
event and of the other safeguards applied to this scenario. Here, the team of
experts must decide which independent protective layers can be used. We can
therefore consider here that the Pressure Safety Valve (PSV) on the separator
vessel can be provided,
 |
| Fig-2 - Pressure safety valve |
Let’s
take the PSV-50 which will protect the separator vessel from excessive
pressure. In addition, it is clearly independent and there would be no impact
from the PV failure. This can certainly reduce the probability of a vessel
rupture by a factor of 10, it can also be expressed as a risk reduction factor
of 10 or a probability of failure on demand of 0.1.
Now
is the time to calculate the expected frequency of the consequence. Here we
need to determine the probability of the triggering event, i.e. the pressure
control valve inadvertently closes and the probability of PSV-51 failure and
the probability of the vessel rupture. The expected frequency can be calculated
taking into account the fact that the vessel is in an area with heavy traffic
and that a person is present when a vessel rupture. Consider 1% chance of death
per year, or 1 in 100 chance.
Now
decide whether the risk is tolerable or not. If the risk is acceptable based on
the tolerable frequency, make a risk-based decision, is this process as safe as
we want it to compare what we calculated and the tolerable frequency this
scenario is 100 times more likely to happen than is acceptable. Since we cannot
accept this risk, we must find a way to further reduce the risk.
Here
we must determine the additional safeguard to reduce the risk of respecting the
tolerable frequency. We can add an independent high-pressure shutdown on the vessel
blanket gas as collateral to eliminate the high pressure source.
 |
| Fig-3- Provision of SIF |
We
can add a backup safeguard that consists of a sensor, logic solver and a valve
called as Safety Instrumented Function (SIF). It is an automated safety action
to bring the process to a safe state. The current system is 100 times more
likely than acceptable. The Safety Instrumented Function (SIF) must reduce the
probability by a factor of 100. The reliability target of this function must
have a probability of failure on demand (PFD) of less than 1%. As this safety
function must reduce the consequence, probably by 100 times, it must meet the
requirements of safety integrity level 2 (SIL-2).
 |
| Fig-4-Provision of safety instrument system with SIL level calculation |
Here, the
combination of the sensor, logic solver and the final element meets the
requirements of safety integrity level 2. Now we can calculate the new expected
frequency of the system, as below;
With
safeguard, expected frequency = 0.1 (PFD of Valve) x 0.1 (PFD of safety valve)
x 0.01 (PFD of SIF)
=
0.0001/year
= 0.01 %
per year
Here, the
final result is 0.01% chance per year. So finally, we can conclude that the
likelihood of the vessel over pressurization is within tolerable frequency and
risk is acceptable.
Conclusion
The
layer of protection analysis (LOPA) is a risk assessment tool which
is used for a systematic decision-making process and one of the methods for
determining the risk associated with various hazardous process events using
their severity and the probability of the events occurring. By evaluating the process
failure causes in reference to HAZOP, a team of expert deciding the best
control to minimize the risk at tolerable level. It is step by step process
where independent safeguard are identified and risk level is compared with
company set target for tolerable of risk. Provision of Safety instrument
system with safety instrumented level may reduce the risk at tolerable level.
Related Articles


its nice and very good information, HOW PFD value decided
ReplyDeleteThanks for appreciation
ReplyDelete